
2024 Global Asset Allocation
Introduction
The Aureus annual asset allocation review evaluates the risks and opportunities available in global financial markets and their potential impact on our clients’ investment portfolios. Our Asset Allocation Policy describes our positioning for the coming year and may be adjusted as market conditions evolve.
Beyond this annual perspective on global allocation, Aureus develops a customized investment policy for each client based on their specific goals and objectives
Summary
The Aureus 2024 global asset allocation review combines critical interpretations of global market factors with a focus on the following:
Asset classes are grouped into three risk categories: Lower, Moderate, and Higher. The allocation presented below represents a ‘base case’ composite for portfolios. In practice, each client is adjusted based on risk and return factors specific to their investment objectives. Specific allocations below represent our opinion over the course of 2024. They are subject to changing information and market movement and may be higher or lower at certain points during the year.
2024 Asset Allocation Summary

2024 ASSET CLASS COMMENTARY
This year’s asset allocation reflects the following adjustments compared to 2023.
LOWER RISK: LOWER RISK ASSETS ARE REDUCED TO 20%.
Treasury Bills (6 months) currently yield 5.2% after spending much of the past year in the 5.5% range. The last time we saw yields at this level was pre-financial crisis in 2007. With inflation below 4%, they deliver a real rate of return. However, the Fed has indicated that rate increases are most likely behind us, and the market is looking forward to rate cuts in 2024. If they cut rates, T-Bill yields will follow the Fed’s move lower, reducing cash returns. Our cash allocation for 2024 is 2%, to be used primarily for liquidity.
Absolute Return investments are designed to provide a 5-7% return, or inflation plus 2-3%, with less volatility than equities and a lower correlation to interest rates than other fixed income. This allocation has performed well over the past several years, and we expect continued positive performance. For 2024, we are lowering our allocation to absolute return to 8%, reflecting higher yields in high-quality bonds and available yields in the moderate risk categories of real estate and private credit.
After a meaningful increase in our allocation to high-quality bonds a year ago, we are slightly increasing the allocation to 10% for 2024. Intermediate bonds currently produce a 5% return and have the potential to benefit from declining interest rates, should that occur this year. We expect bonds to serve their role in a portfolio by providing current income and producing returns negatively correlated with equity markets in the event of an economic recession. When taken together, high-quality bonds and Absolute Return investments comprise 18% of the lower risk allocation.
MODERATE RISK: MODERATE RISK ASSETS ARE INCREASED TO 11%.
Over the last several years, we have increased our allocation to the moderate risk category; for 2024, we are increasing this to 11%. We have expanded the category to include real estate this year, following the addition of private credit two years ago.
Real estate is being added as a new category with an allocation of 4%. The real estate sector has been under pressure due to higher interest rates and specific factors impacting areas in commercial real estate, such as urban office buildings and brink-and-mortar retail. Residing in the moderate risk category, the allocation is more conservative (not speculative) and designed to take advantage of current income and potential for modest capital appreciation from high-quality property holdings.
We continue this year with a slight reduction in Directional Strategies to 3%. Historically, these investments have been “hedged,” meaning they should participate in periods when equity markets move higher and protect on the downside when equity markets correct. We have been moving away from hedged equity strategies and toward other strategies, such as credit-related investments in the directional allocation. We expect to continue this shift in 2024.
Private Credit continues to be an attractive area in the moderate risk category. We are slightly increasing the allocation to 5% for 2024. We maintain our 0% weighting to High-Yield investments, preferring private credit strategies. High yield investments are not currently offering sufficient yield spreads to high-quality fixed income and the risk of defaults in this higher interest rate environment adds uncertainty.
HIGHER RISK: HIGHER RISK ASSETS ARE SLIGHTLY DECREASED TO 69%.
Our largest allocation remains with US Equities, which is maintained at 50%. Combining the bear market year 2022 (-18%) with the bull market year 2023 (+26%) produces a two-year annualized return of only 1.7%. Last year’s market return was dominated by a few mega-cap stocks, with many good, high-quality stocks not participating. While valuations are modestly higher than historical averages, we believe that there are opportunities among those overlooked names that will provide positive returns in the coming years.
We are reducing our exposure to International equities in 2024 to 16%, with an equal split between Developed and Emerging Markets. From a valuation perspective, international equities look cheap compared to the US markets. However, when looking under the hood, international equity markets – relative to US markets – are significantly underweight to the faster growth sectors of Information Technology and Communication Services and overweight to the slower growth sectors of Financial Services, Industrials, and Materials. The valuation difference is justified, but having international exposure is essential in a diversified portfolio. Japan looks particularly attractive in this category as its economic fundamentals continue to improve. Conversely, we remain concerned about China as it struggles with leadership stifling innovation, geopolitical tensions with the US, an ongoing credit crisis, and unfavorable demographic headwinds.
For 2024, we are adding an allocation to Private Equity/Venture Capital of 3%. This partially reflects our commitments to PE/VC funds over the past 12 months, which will have more capital called in 2024. These asset classes have produced excellent returns over time and may be appropriate for clients. Given write-downs in private market valuations over the past two years, the outlook for new current vintages in these funds may be attractive. In general, these investments offer limited to no liquidity, and the realization of returns can take upwards of 7-10 years. For those clients with sufficient liquidity, longer time horizons, and suitable risk appetite, PE/VC may be an appropriate asset class allocation.
2023 YEAR IN REVIEW
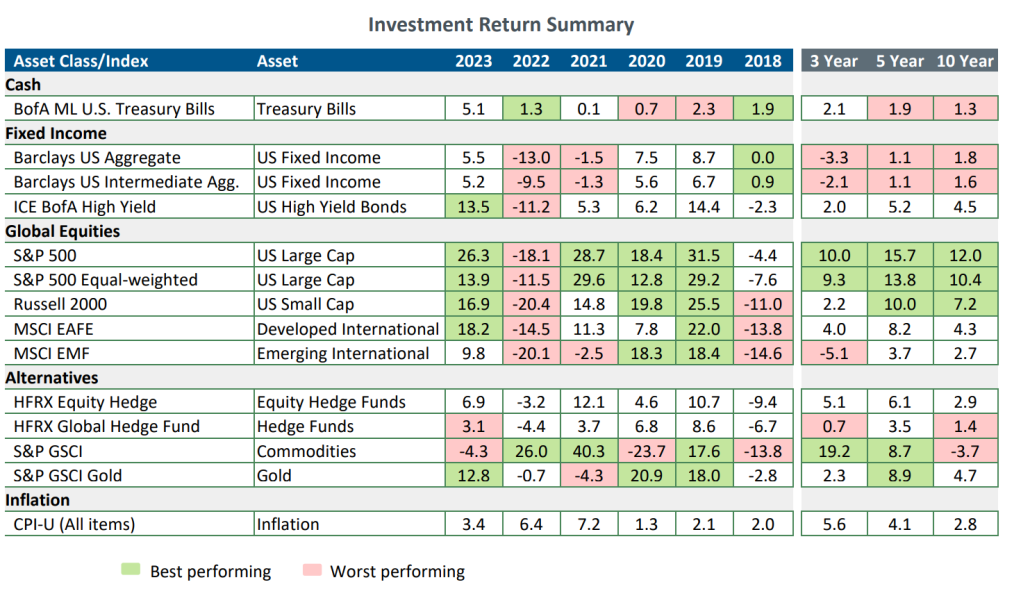
To state the obvious, 2023 was a very different year compared to 2022 for investor returns. As measured by the S&P 500, US stocks finished the year with a 26.3% return, within 0.6% of the all-time high set in January 2022. International stocks were also higher for the year, with developed markets returning 18.2% and emerging markets 9.8%. Fixed income investments, from shorter T-Bills to the longer maturity bond market aggregates, provided positive returns in the 5.0-5.5% range, a welcome change over 2022. The only asset class with negative returns in 2023 was commodities at -4.3%, which followed the very good years of 2021 and 2022. After protecting capital in the 2022 bear market, hedge fund indices provided low-mid single-digit returns in 2023.
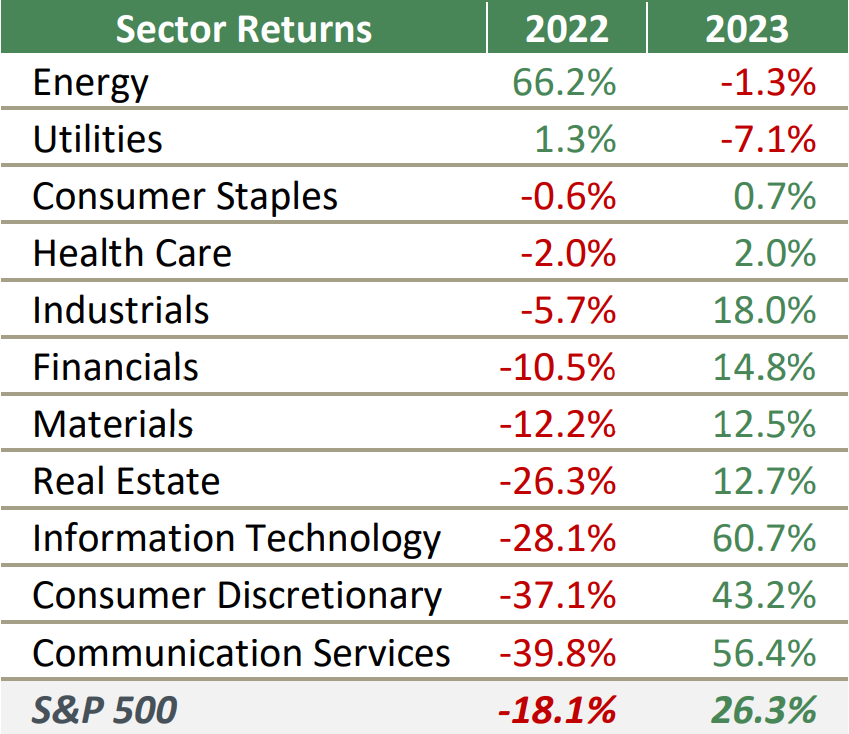
A leading story in the 2023 US equity markets was the dramatic shift in sector returns from value in 2022 to growth in 2023. The table to the right shows the sector leaders for the two years. As shown, the best 2022 sectors of energy, utilities, and consumer staples were the worst sectors in 2023. The laggards in 2022 of communication services, consumer discretionary, and information technology were the top sectors in 2023.
The other key story was the dominance of the largest capitalization stocks in the S&P 500, also referred to as the ‘Magnificent 7’. Comprising 28% of the market, these seven stocks – Apple, Microsoft, Alphabet, Amazon, NVIDIA, Meta, and Tesla delivered 15.5% of the S&P 500 return of 26.3% (nearly 60%).
The Federal Reserve continued its battle with inflation during the first half of 2023, moving the Fed Funds rate from 4.5% to 5.5% by July. Since that time, rates have held steady at the 5.5% level. Whether due to Fed action, continued recovery of supply chains post-pandemic, or simply higher prices changing behavior, inflation fell from 6% in January to 3.3% in December. Interest rates, both 1-year and 10-year Treasury yields, spent most of 2023 moving higher before falling back to levels only slightly above the start of the year. The yield curve remains inverted, with the 1-year closing in 2023 at 4.8% and the 10-year at 3.9%. Both now provide a positive real rate of return – a material change from recent years.
Mortgage rates for 30-year fixed-rate loans started in 2023 at 6.4%, rose to 7.8% in October, and ended the year at 6.6%, again only slightly above where they started. Investment-grade corporate bond yields traded in the range of 5.5% to start the year, reaching 6.4% in October before closing at 5.2%. High-yield bonds experienced a similar path, trading at 9.0% to start the year, reaching 9.5% in October before closing at 7.8%. Spreads between the two closed at the narrowest level of the year, 2.6%.
Geopolitical risks continued to unnerve investors as the Russia/Ukraine conflict was about to enter its third year. In October, Hamas-led Palestinian militants attacked Israel, triggering a severe response and the beginning of the most recent war. Both conflicts bring global economic uncertainty, and we remain concerned about a spread outside these boundaries, particularly in the Middle East. Resolution for both does not seem imminent and may be with us throughout 2024.
The “most anticipated recession in history” failed to arrive again in 2023. While we will have a recession at some point, the resilience of the economy post-pandemic has certainly frustrated bears over the past two years. We believe the strength of the post-pandemic economy can be attributed to three key factors.
- Consumers continued to spend down stimulus funds received during the pandemic, and more recently, this has been supplemented with other larger government stimulus plans such as the Inflation Reduction Act. These have helped stimulate the economy but have also resulted in the largest US fiscal deficits experienced outside a war or recession.
- Labor demand has proven incredibly durable as the combination of renewed demand for service-related jobs—as consumers return to pre-pandemic activities—has crossed with a gradually retiring baby boomer cohort.
- Most industries we track have experienced a recession at some point over the past three years. They have not experienced them simultaneously. In many cases, this is because COVID-19 helped some businesses while hurting others. So, as we return to pre-pandemic patterns, that has simultaneously hurt some businesses while others have recovered.
These factors have been enough to offset monetary headwinds caused by higher interest rates and quantitative tightening (the reduction of the Fed’s balance sheet). As expected, these monetary headwinds have disproportionately impacted industries that rely on lending, thus making them more interest rate sensitive (e.g., autos, housing, commercial real estate, banks). Fortunately, most businesses used the low-interest environment immediately post-pandemic to lock in low interest rates and push out maturities on their loans. Those companies exposed to rate hikes are cheering moderating inflation and the prospect of the Fed cutting interest rates in 2024.
2024 MODEL FACTORS
MODEL FACTOR 1: FUNDAMENTALS
Key considerations include economic prospects, inflation expectations, and the corporate earnings outlook.
ECONOMIC OVERVIEW
SLOWING GROWTH
We are entering the fifth year since the pandemic began in early 2020. For the most part, economies have returned to normal, with the notable addition of “pandemic risk” as a new factor to consider.
Global GDP is projected at 3.0% for 2024. Government stimulus plans have ended, and central bank easing is being replaced by central bank tightening considerations, which has the effect of slowing growth. Some economic regions, such as the Eurozone and the Middle East, are dealing with geopolitical issues close to home that impact many aspects of their economies.

The US economy has proven resilient, and we have not experienced a recession since Q2 2020, the height of the pandemic. The rolling recessions of 2022 and 2023 appear to be behind most sectors. GDP is expected to be in the 3% range for 2023. Corporations have managed through the recent bout of inflation, balance sheets are solid, and corporate earnings have returned to near record levels. The labor market has eased with job openings moving toward pre-pandemic levels. Wage growth has moderated to 4.0%, giving consumers real wage growth over inflation.
Some factors to focus on as we move through 2024 are:
- The path of inflation toward the Fed’s 2% target. Many inflation components are running at or below the 2% level, particularly for consumer goods. The largest component of shelter, which comprises 35% of the CPI, will be slow to come down and currently is running in the 4-5% range.
- The timing and scale of Fed rate cuts in 2024. As of this writing, the markets expect rate cuts to begin in May and reduce the rate to the low 4% range by the end of 2024. The Fed has indicated that rate hiking is over but remains committed to avoiding reflation later in 2024. We expect the Fed to continue its data dependency approach and be cautious in lowering rates too fast and too far.
- Employment picture. The unemployment rate, expected to rise following the Fed rate increases, has remained below 4% for the last two years. Given its dual mandate of price stability and sustainable employment, this will be a data item watched closely by the Fed.
- The trajectory of energy prices. Oil prices were less volatile in 2023 than in 2022, with a high of $95 and a low of around $65 per barrel. Changes in energy prices can have a rapid impact on the economy. While prices remain well off their highs, the potential of rising demand from China and supply shocks due to geopolitics could lead to an unpredictable range in 2024.
A DIVIDED WASHINGTON
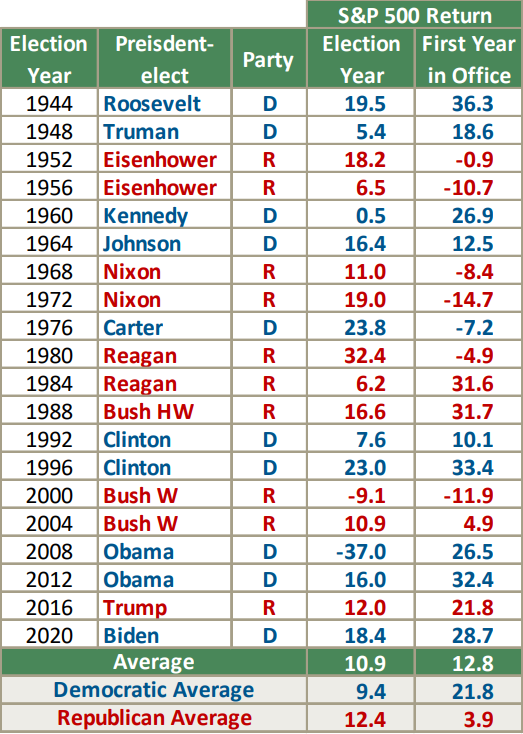
It’s no surprise that a divided Washington continues, and for 2024, we introduce the agitation of a Presidential election to the mix. We would not expect much more major legislation to pass in an election year. It is important to keep in mind that while Wall Street (and associated media content) tend to give a lot of airtime to what might happen depending on which candidate wins the Presidency, historically, there is very little evidence to suggest the market performs differently under different party leadership (see table). Congress is currently wrestling with a catch-all funding bill that includes aid to Israel and Ukraine, US border security, infrastructure spending, cuts to IRS funding, and, of course, funding for all federal departments. As usual, Congress finds itself against a self-imposed deadline to avoid partial shutdowns. They will most likely avoid this scenario by pushing the deadline to a future date.
It is worth noting that the 2017 Trump tax cuts are scheduled to expire at the end of 2025. This resolution largely depends on the outcome of the November election.
CONSUMER ECONOMY

EMPLOYMENT & WAGES
The national unemployment rate currently sits at 3.7% and has remained below 4% for the last two years. Expectations that increased interest rates would cause unemployment to rise have yet to be realized. Wage growth of 4.1% has dropped from 5.9% a year ago, but with the inflation rate dropping below wage growth, consumers now have growth in real earnings. This has historically been a positive for consumers’ willingness to spend. Job openings remain higher than pre-pandemic levels, providing a very solid employment picture going into 2024.
CONSUMER SENTIMENT
One point of confusion for economists in 2023 was why Consumer Sentiment has remained depressed despite a healthy job market, real wage growth, strong market returns, and fading inflationary pressures. Generally, consumers are in good shape with low unemployment and rising wages, so why don’t surveys reflect this reality? It is possible the political divisions and the constant drumbeat of negative media are responsible. It is also possible that it takes time for consumers to digest the reality of fading inflationary pressures, and we may see sentiment indicators improve on a delay. Consumer Sentiment tends to be a good indicator of consumers’ willingness to spend, particularly on large ticket items. One area that has not improved is consumer savings. The excess savings collected from government stimulus checks during the pandemic have been depleted through consumer spending. Estimated at $2.1 trillion at its peak in 2021, this number has been reduced to $400 billion. The savings rate has not recovered to support this aspect of consumer balance sheets. The current savings rate of ~4% is notably below the 5-7% pre-pandemic rate.
MORTGAGE RATES & HOUSING ACTIVITY
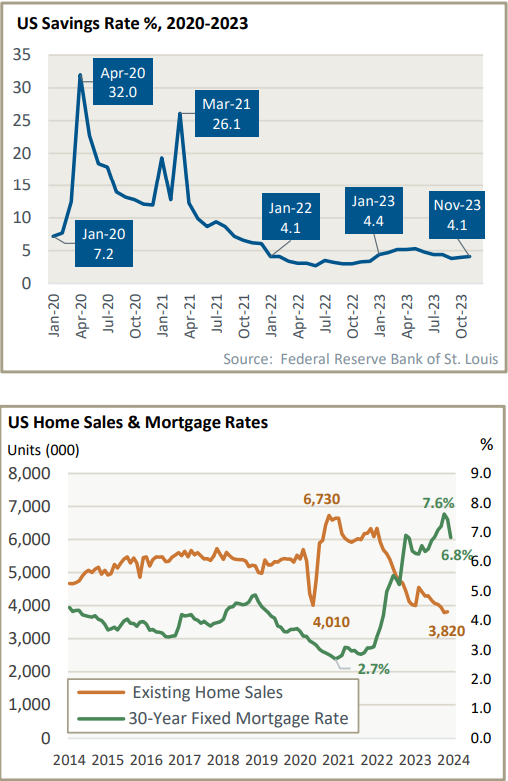
Fed rate hikes over the past two years have had a pronounced impact on the housing market. As recently as 1Q22, consumers could receive a 30-year mortgage with an interest rate below 3%. Mortgage rates climbed alongside the Fed funds rate, peaking at almost 8%. This created two notable headwinds for housing turnover. Owners locked into low-rate mortgages became reluctant to move and lose their current attractive interest rate – hurting supply. Buyers looking to acquire were faced with high interest rates that dramatically increased the monthly cost of home ownership – hurting demand. This drove existing home sales to the lowest level since the housing crisis of 2008-2010. The lack of supply helped support home prices (the largest source of wealth among many families). The lack of home turnover has been a drag on the economy since home purchases usually drive remodeling activity and spending on furnishings for two years following a purchase. The decline in mortgage rates over the past two months and expectations for Fed rate cuts in 2024 could provide a beneficial tailwind to economic growth in the second half of 2024.
GLOBAL MONETARY POLICIES
Last year, major central banks faced the challenge of pivoting from stimulative fiscal and monetary policies implemented in response to the pandemic to tighter monetary policy to deal with rising inflation. The risk of these more restrictive policies is they dampen economic growth and, in the worst-case scenario, lead to recession. To avoid this, another pivot is required to ease monetary policy (lowering interest rates) without causing inflation to roar back. The presumptive first mover in this pivot is the US Federal Reserve, given the positive path of inflation in the US. China has also indicated further easing, while European central banks have remained hawkish to date.
OIL PRICES
Oil prices remain volatile, although less so than in 2022, trading in a range of $72 to $96 in 2023. US production is at record levels on the supply front, offsetting much of the supply cuts from OPEC+ members. Demand fell due to a general weakening in the macroeconomic climate and a slowing in China. Expectations of global shortages and higher prices resulting from the Russia/Ukraine conflict and expansion of the Israel-Hamas war have yet to materialize. Combining these leads most to project a trading range for oil similar to the experience of 2023.

Natural gas, a primary heating source for Europe, experienced much lower prices in 2023 compared to 2022, with prices as high as $9.00 per MMBtu. Currently, the commodity is trading at less than $3.00 per MMBtu, very near the lows of the last 25 years.
INFLATION
The Consumer Price Index (“CPI”) finished 2023 with a 3.3% year-over-year increase, a material decrease from the 9% level observed in June 2022. Whether the reduction was because of Fed-induced lower demand, waning consumer spending desire, or improvement in supply chains, inflation is at a very different place in 2024.
The Fed did its part, raising rates from 0.25% to 5.5% – eleven increases over sixteen months, for a total increase of 5.25%. Currently, the Fed Funds rate is 5.50% and has been steady at that level since June. The Fed is now focused on achieving its stated target of 2.0%. This may take some time as the more stubborn components, such as shelter and services, tend to move more slowly. Also, if GDP exceeds expectations, inflation can return.
The causes of inflation are well-known, many having their origin in disruptions related to the global pandemic in addition to the resulting fiscal and monetary response. What remains to be seen is the endurance of inflationary factors, and the risk of reflation should economic activity strengthen. Goods/commodities inflation has fallen, and many components are at or below the Fed’s 2% target. Services inflation has been slower to subside; the more significant component of shelter (35% of CPI) is running at an annualized rate of 6.2%, and transportation (6% of CPI) came in at 9.5%. To achieve the 2% target, these components must move lower – we believe they will, but it will take several quarters.
For the last 18 months, the focus has been on inflation. It is worth noting that the Fed has a dual mandate of price stability and sustainable employment. As the chart below indicates, inflation has come down materially from the 9% experience in June 2022 and has been in the 3-4% range for the last six months. Notably, the labor market has been strong, and unemployment continues below 4%, which has been the case for two years.

CORPORATE EARNINGS
While not all companies have reported Q4 earnings at the time of this publication, earnings growth for the S&P 500 is estimated to have grown by roughly 1% in 2023. While this tepid growth rate trails the 10-year average earnings growth rate of 8.4%, it still represents growth in a year when most economists and market prognosticators expected the U.S. to fall into a recession. Earnings growth was hampered by waning consumer demand due to sustained inflationary pressures and significantly higher interest rates. On a quarterly basis, S&P 500 earnings declined by 1.7% and 4.1% in Q1 and Q2, respectively, before returning to growth of 4.7% in Q3, the first year-over-year increase since Q3 of 2022; earnings are expected to have grown by roughly 4% in Q4. On a sector basis, eight sectors reported year-over-year growth in earnings in 2.50 1.69 5.38 8.93 3.30 3.50 14.70 4.00 3.70 0.25 0.50 2.50 4.50 5.50 0 2 4 6 8 10 12 14 16 H1 2020 H2 2020 H1 2021 H2 2021 H1 2022 H2 2022 H1 2023 H2 2023 Rate % Federal Reserve Dual Mandate Price Stability & Sustainable Employment USA – CPI Total (YoY%) (Left) USA – Unemployment Rate Fed Fund Target Rate 2023, led by Consumer Discretionary and Communication Services. Three sectors reported year-over-year declines: Energy, Materials, and Health Care.
2023 sales growth for S&P 500 companies is expected to be roughly 2%, which is below the trailing 10-year average of 5.5%. On a quarterly basis, revenue for the S&P 500 grew by 4.1%, 0.9%, and 2.4% in Q1, Q2, and Q3, respectively. For Q4, the estimated revenue growth rate is 3%.
After a lackluster year of earnings growth in 2023, earnings growth is expected to bounce back strongly in 2024, with current estimates calling for nearly 12% growth. Sales growth is predicted to rebound to 5.5%. These estimates are predicated on resilient consumer demand buoyed by strong employment and wage growth, subsiding inflation, and the expectation for lower interest rates in 2024.
ECONOMIC GROWTH
UNITED STATES

Real GDP in 2023 surprised to the upside with a rate of 2.5%-3.0% and no recession. Expectations for 2024 are similar, with moderate growth and a recession, if any, being mild and short-lived. Thus far, the “soft-landing” scenario is likely, with some slowing caused by higher interest rates in 2023 offset by resilient labor markets, strong consumer spending, and a Fed with room to lower rates if necessary.
EUROPE AND JAPAN

European economies remain precarious, with inflation under control but a looming risk of recession due to factors like increasing energy prices, ECB interest rate hikes, limited fiscal stimulus, and challenges in boosting consumer confidence. Any potential peace agreement between Russia and Ukraine would be a welcome development, but there are currently few signs of a truce. The outlook for Japan offers some positives, including healthy inflation, growing real wages, and increased corporate sector optimization, but these encouraging signs are tempered by demographic challenges and the complexities of managing monetary policy.
EMERGING MARKETS

In China, economic challenges stemming from real estate issues continue to affect consumer confidence. Government measures aim to boost the economy, while positive aspects include China’s role as a major exporter in strategic sectors and improving US-China relations. However, China faces a challenge in shifting toward greater domestic consumption. The outlook for emerging markets ex-China appears positive, exhibiting resilience in the face of elevated global interest rates, driven by ongoing reforms, strong domestic consumption, and healthy balance sheets, with countries like India and Mexico poised to attract foreign investment and boost capital expenditures.
MODEL FACTOR 2: VALUATION
Key considerations are valuation and yields, viewed historically in absolute and relative terms.
EQUITIES
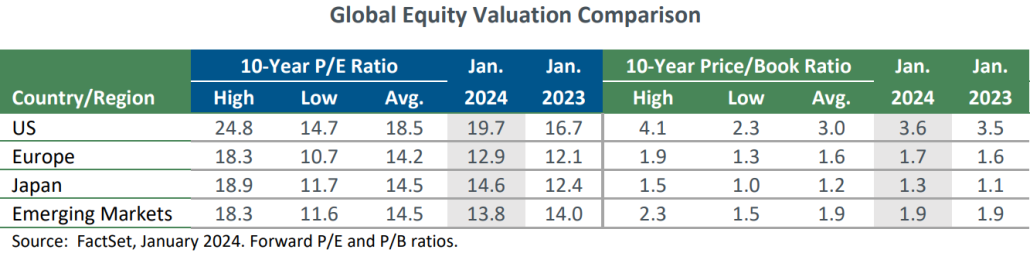
The US market price/earnings ratio finished the year at 19.7x forward earnings, expanding from 16.7x one year ago. This puts it above its 10-year average but below the high of 24.8x. It is not surprising that the multiple would increase in a year where the S&P 500 rose 26%, earnings grew a minimal 1%, and interest rates approached 5%, dampening equity valuation. With an expected rebound in sales and earnings in 2024 and the prospect of lower interest rates, the current PE multiple does not seem limiting for continued good performance from equities.
Equity valuations in Europe, Japan, and emerging markets are only modestly higher than last year. While these markets seem “cheap” to the US, we have grown accustomed to this discount as these economies have lower growth rates and generally less dynamic companies than the US. As discussed above, troubles in China and geopolitical risks remain a material headwind for most major international markets.
BONDS
Interest rates continued to move higher in 2023 in response to the Fed rate increases that began in 2022. As the chart below highlights, the 1-year US Treasury yield (blue line) traded as high as 5.5% in September before closing the year at 4.8%, about where it started. The 10-year (green line) followed a similar path, trading up to 5.0% in October, before closing at 3.9% or where it started the year.

Expectations are that the Fed will move toward lowering rates in 2024, although the timing and magnitude have yet to be revealed. With inflation now below both these yields and the economy showing signs of slowing, there is less motivation for the Fed to keep rates at current levels. The risk of not lowering rates may result in a weaker economy and pressure on the credit markets for borrowers. The risk of lowering rates is that inflation may not be fully under control and could reinflate, causing future rate increases. We expect the Fed to be data dependent, as they have often stated, and continue focusing on moving inflation toward the 2% target. Should the data continue current trends, we expect the Fed to gradually lower rates, although not as soon as expected by many and not as large as anticipated.
As is the practice in Washington, the debt ceiling needs to go higher – most likely at the last possible date. While we expect this to happen, the rise of fiscal conservatives in the House has the risk of making this uncomfortable for bond investors and adding volatility to interest rates.
Except for the UK, most developed market bonds continue to yield below those in the US. Most developed markets followed (lagged) the US in efforts to lower inflation by raising interest rates, likely due to uncertainty in their economies and existing geopolitical risks. We expect the same to hold true as inflation comes down in their economies and economic growth moves higher on the priority list.
MODEL FACTOR 3: GEOPOLITICAL
Key considerations are government and political conditions in specific geographies that may impact economies and investment markets.
UNITED STATES
The geopolitical risks expanded in 2023 with the onset of the Israel-Hamas War to the ongoing Russia-Ukraine conflict. The US is now involved with two major conflicts with support to date of money, munitions, and only minor direct on-ground involvement from our military. Both of these conflicts have the risk of escalation, and the outcome of each is important to global economies. Relations between China and the US remain complex, with co-dependence on economic issues and Taiwan-related tensions.
EUROPE
The Russia-Ukraine continues and is moving into its third year. The economic costs and disruptions to neighboring Europe have thus far been manageable, with sufficient energy supply and price to avoid major economic impact. The expansion and strengthening of NATO are positive longer-term for stability in the region if/when the current conflict is resolved. Brexit is now three years old, with progress on trade and immigration issues, but longer-term implementation issues remain.
EMERGING MARKETS EX-CHINA
China’s slowing growth and changing dynamics are affecting Asia ex-China directly. Investors are becoming cautious about China and seeking alternative investment opportunities within Asia, particularly in countries like India and Vietnam, as they diversify their portfolios. The need to reduce reliance on China as the primary growth engine is a driving factor behind this trend.
CHINA
The geopolitical risks in China center around its economic slowdown, which could have far-reaching consequences. China’s high youth unemployment rate and the crisis in the real estate sector pose significant domestic challenges, potentially leading to social unrest. Internationally, the risk of a failing Chinese economy impacting the global economy is substantial, given China’s considerable share of global GDP. President Xi Jinping faces a delicate balancing act between addressing economic issues and managing growing geopolitical rivalries. This could lead to varying outcomes in 2024, from a less aggressive foreign policy to more assertive approaches. The Taiwan situation remains open and highly dependent on the US/China relationship, as any response to China’s intentions has global economic implications.
MODEL FACTORS: SUMMARY TABLE

EXPECTED RETURNS
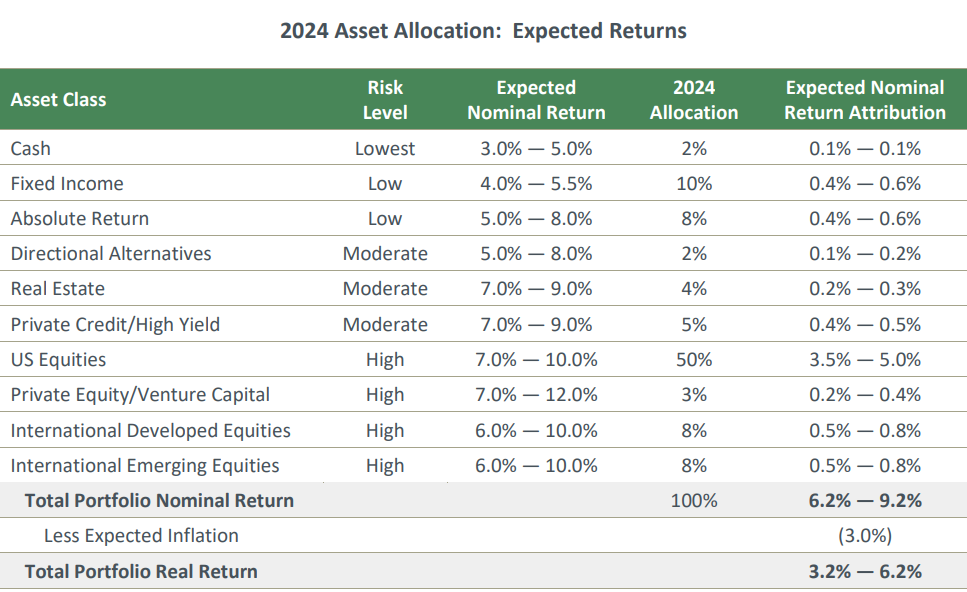
Calculating expected returns is mainly a quantitative exercise to establish a range of returns for asset classes and an overall “average” portfolio. History has shown that these asset classes rarely deliver these expected returns during any one calendar year, given the cyclicality and volatility of individual asset classes. For example, US equities returned -4.4% in 2018, followed by 31.5% in 2019, 18.4% in 2020, 28.7% in 2021, -18.8% in 2022, and 26.3% in 2023. Looking over the last 20 years, the annualized return is 9.8% for US equities – a more appropriate number for this exercise. Over longer periods, these more volatile one-year returns are smoothed, and returns generally move toward longer-term asset-class averages. The expected nominal returns in the table above incorporate factors specific to our view of the current market environment. They allow us to express our assumptions and apply them to a client’s portfolio.
For 2024, following a very strong year in stocks and a moderate return year for bonds, we expect more “normal” returns from asset classes. Some clients may require a rebalancing after the strong performance in the US equity markets in 2023, and our opinion is to maintain the US allocation at 50%. In a base-case portfolio implementation, we would expect a diversified portfolio to generate expected nominal returns in the 6.2% to 9.2% range; with inflation estimated to be 3.0% (lower than 2023), the real return could be in the range of 3.2% to 6.2%.
As always, we remain diligent in our approach to the financial markets and managing our client’s investment portfolios. As new information becomes available, we will update our models and adjust our allocations when market conditions warrant.
We appreciate the opportunity to share our views and welcome your questions and comments.